The Insights screen allows you to visualise some of the data that is captured when your team uses Stream, including
- Vehicle Checks
- Delivery Runs
The Insights screen was previously called the ‘Charts’ screen, and was updated in March 2024.
How to view the Insights screen
Access to the Insights screen can be enabled for individual users within your Stream account.
Step 1: Enable the Insights Menu Item
From the main menu in the top right-hand corner of Stream, click ‘Users and Drivers’.
In the ‘Users’ list, double click on the user (or single click and press ‘Edit) to view their individual User Details.
In the popup window, click ‘Custom Settings’.
In the Custom Settings popup, look in the ‘Menu Options’ section and make sure ‘Insights’ is enabled.
With this checkbox enabled, the selected user will be able to access the Insights screen, however, if the user is currently logged in, they will need to log out and log back in to Stream in order for the ‘Insights’ option to appear in the menu.
Step 2: Go to the Insights Screen
From the main menu, click ‘Insights’.
You will now see the ‘Insights’ screen.
By default, this screen will show you data for the previous 7 days, however, you can use the date field pickers to select a different date range.
Please Note:
The Insights screen uses data that is captured in Stream Analytics, where the data is only updated on a daily basis and not in real-time, so you will not be able to see data for ‘today’s date’.
You can select a date range spanning up to a maximum period of one month.
Vehicle Insights
From the dropdown menu in the top left, select ‘Checks’
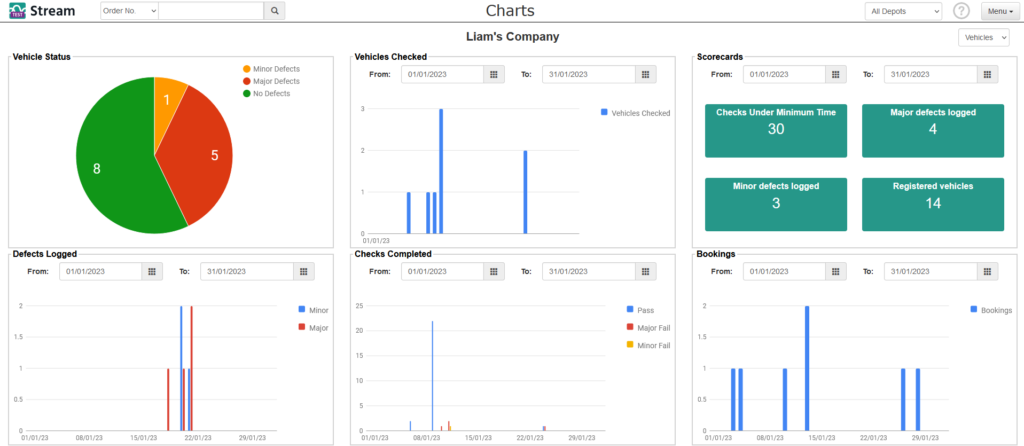
The ‘Vehicles’ dashboard will show you a visual overview of:
- The status of all your vehicles
- The number of vehicles checked in the selected date range
- The number of defects logged in the selected date range
- The number of checks completed in the selected date range
- The number of vehicle bookings in the selected date range
- And some scorecards including
- Number of checks completed under the minimum specified time
- The number of minor defects logged
- The number of major defects logged
- The number of registered vehicles in your account
Delivery Runs Insights
From the dropdown menu in the top left, select ‘Delivery Runs’
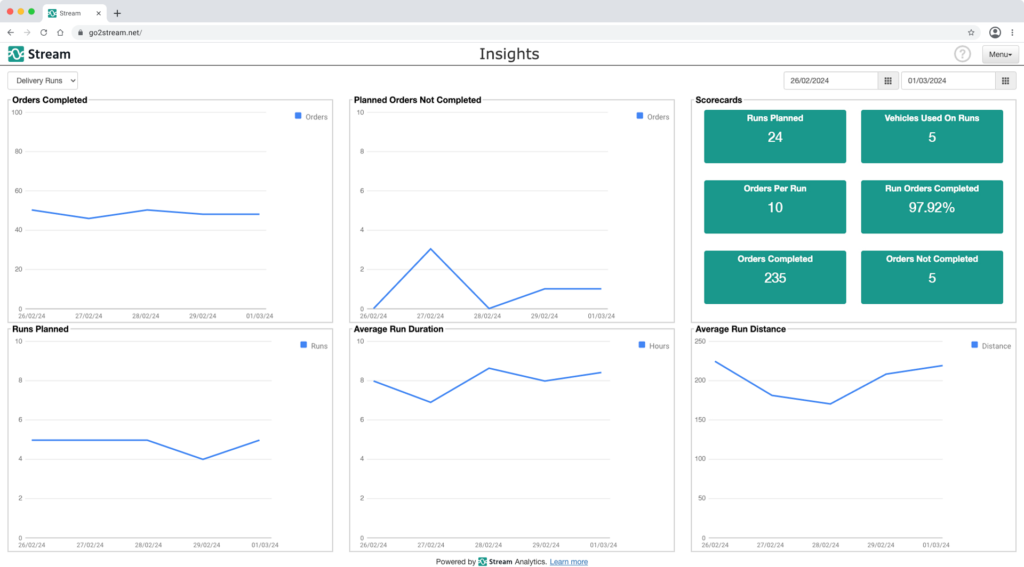
The Delivery Runs dashboard will show you a visual overview of:
- Number of orders completed
- Number of planned orders not completed
- Scorecards (Stats overview for your delivery runs) including:
- Number of runs planned
- Number of vehicles used on runs
- Average number of orders per run
- Percentage of planned orders completed
- Number of planned orders completed
- Number of orders not yet completed.
- Number runs planned
- Average run duration
- Average run distance
Unlock the power of your Stream data with our Analytics Add-On.
Upgrade your account with our Analytics add-on to gain access to all of the powerful data that’s generated by you using Stream. You can plug your Analytics data into your existing business intelligence tools to measure performance and build insights to help you improve your operation.