Stream Late Delivery Index x TomTom Traffic Ranking Index
It seems obvious, doesn’t it?
Of course, traffic levels affect delivery times, don’t they?
Well, you might be surprised.
We cross-referenced data from TomTom’s traffic ranking index and our own late delivery index to discover that actually, traffic might not be the number one risk factor for late and missing deliveries.
TomTom released its 2023 traffic index ranking in January and — perhaps unsurprisingly — London tops the list for the slowest-moving traffic in the UK.
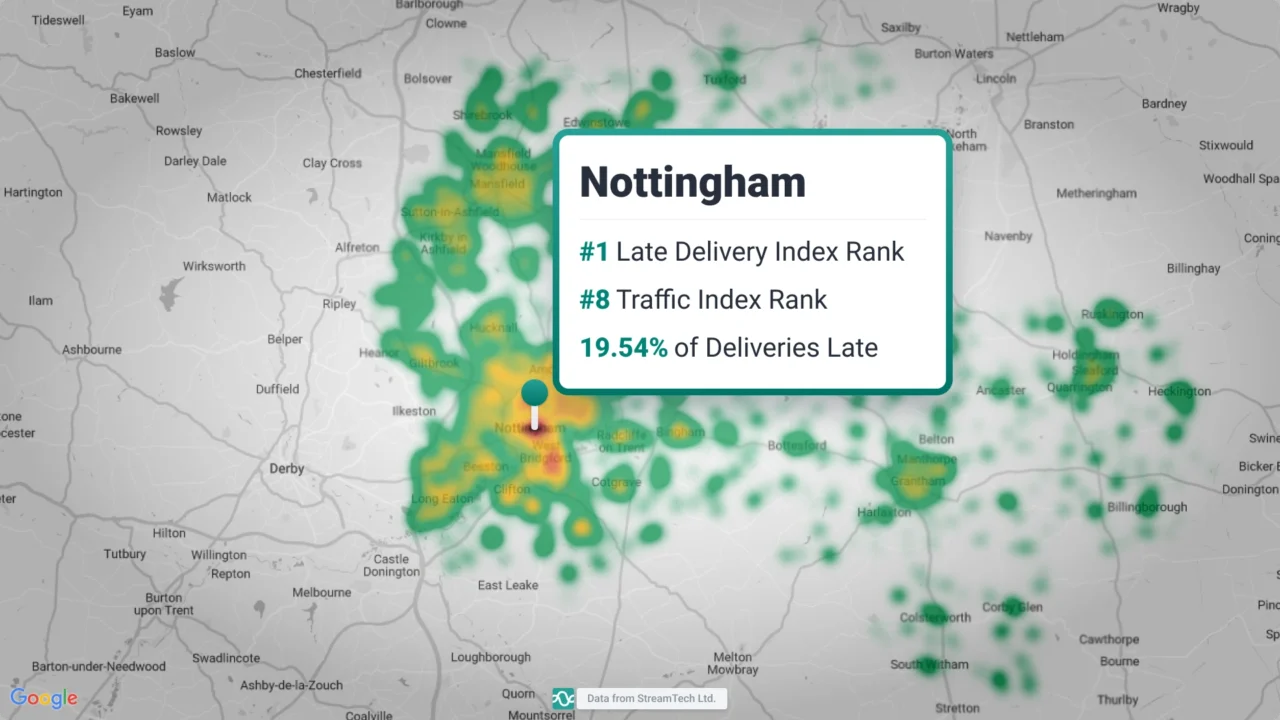
What might be more surprising though, is the results of the 2023 Stream Late Delivery Index, which found Nottingham to be the UK’s worst city for late deliveries, with 19.54% of deliveries arriving late.
Let’s dig a little deeper into the research.
Late deliveries in the UK
Around 90% of deliveries across the UK were successful in 2023, according to Stream’s delivery success data.
Regardless of the amount of careful route planning a business does prior to departure, events on the day of delivery – and traffic congestion in particular, can have a significant impact on the timings of deliveries.
UK cities with the highest proportion of late deliveries
Two cities in the Midlands made it into the top three for late delivery percentages.
1. Nottingham
About 20% of deliveries in Nottingham arrived late in 2023 — that’s 1.74 times the national average — despite coming 8th in the UK traffic index ranking (and taking about 17-and-a-half minutes less to travel 10km than it does in London).
2. Sheffield
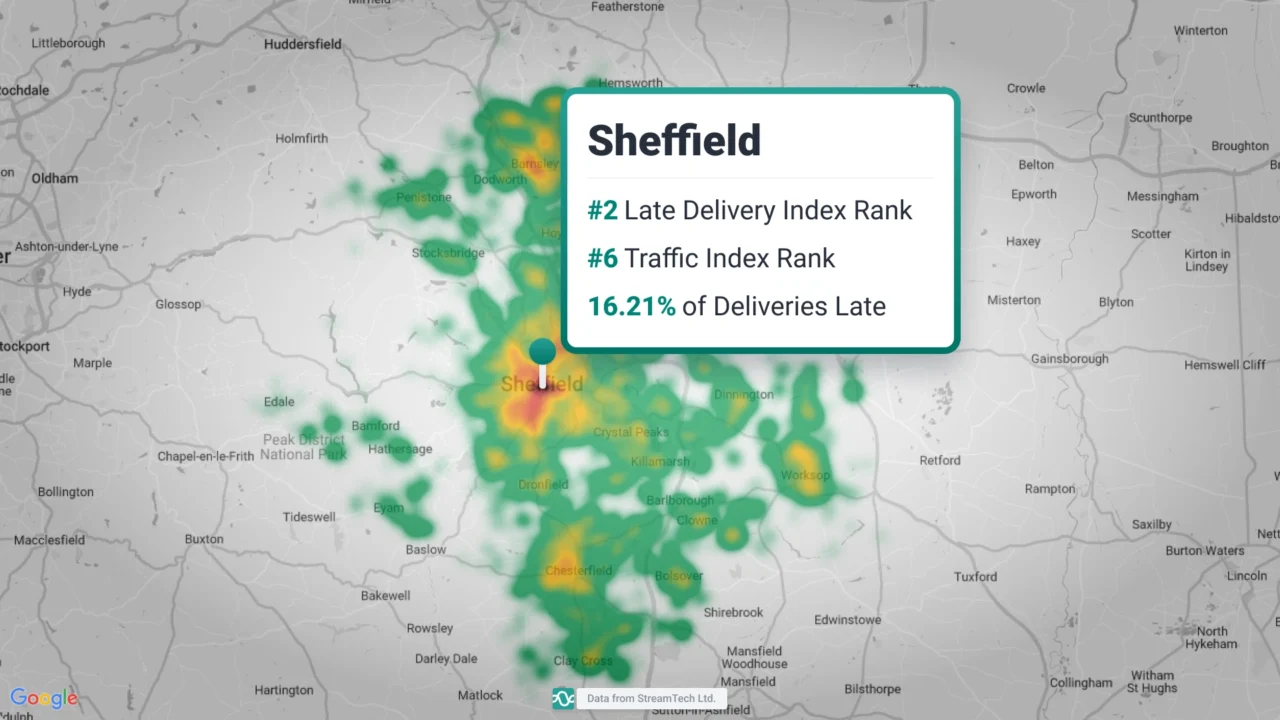
In Sheffield, 16.21% of deliveries arrived late — almost one-and-a-half times the national average. Sheffield comes in 6th place for traffic rankings, however.
3. Leicester
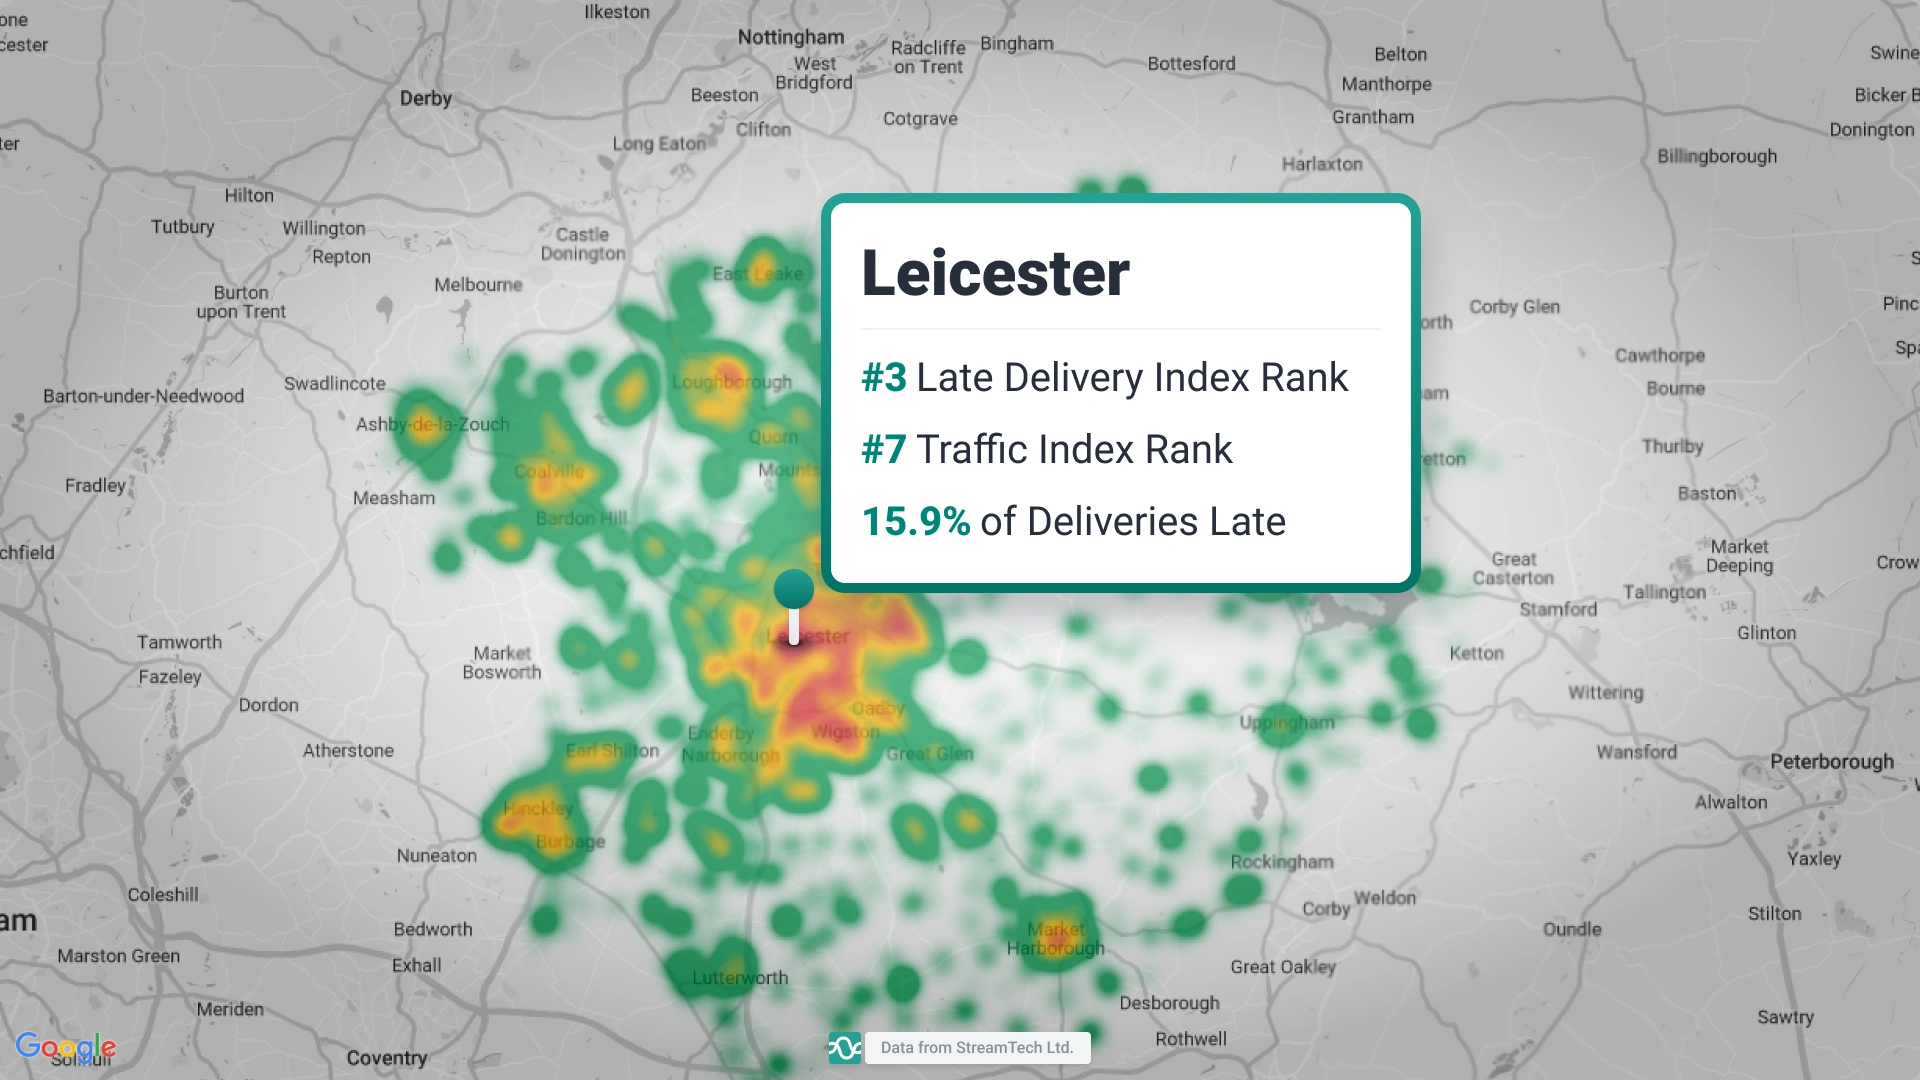
Just behind Sheffield, 15.9% of deliveries in Leicester arrived late, and the city comes in 7th in the UK for traffic rankings.
UK cities with the fewest late deliveries
What about the cities with the lowest percentage of late deliveries?
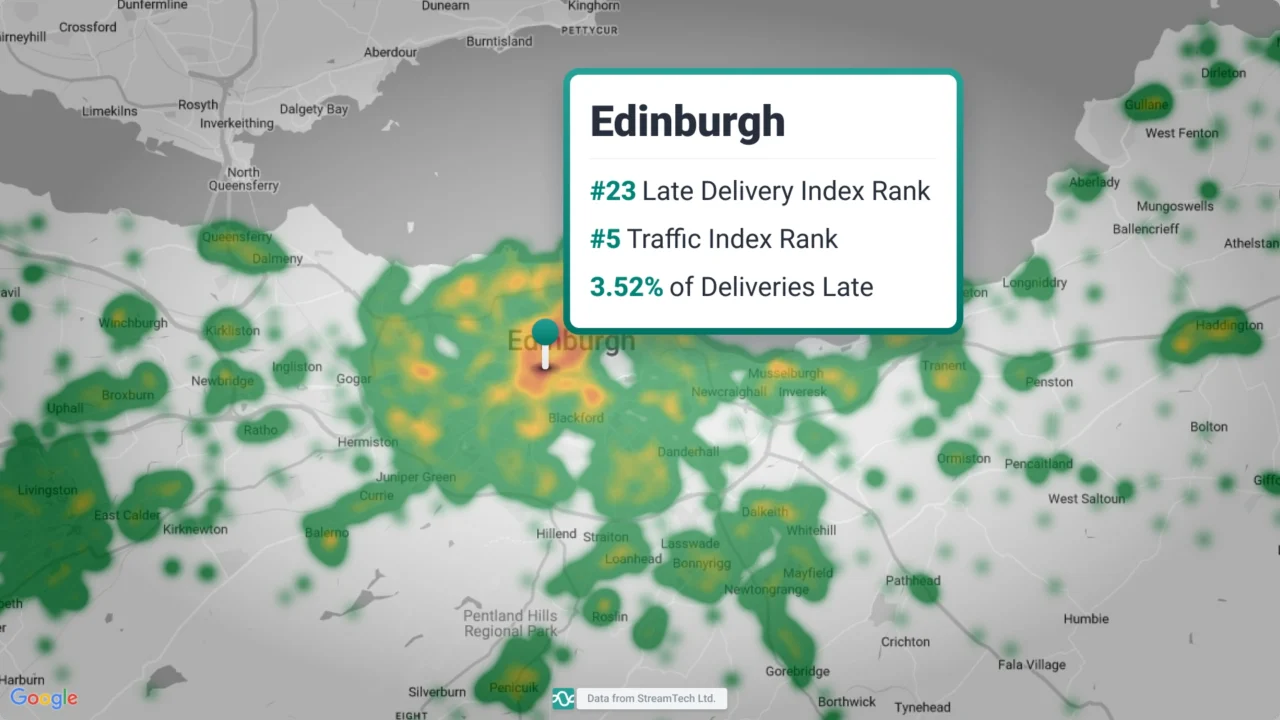
For residents of Scotland’s two largest cities, it’s good news for Glasgow and Edinburgh as they occupy positions two and three, whilst Middlesbrough had the fewest proportion of late deliveries in 2023:
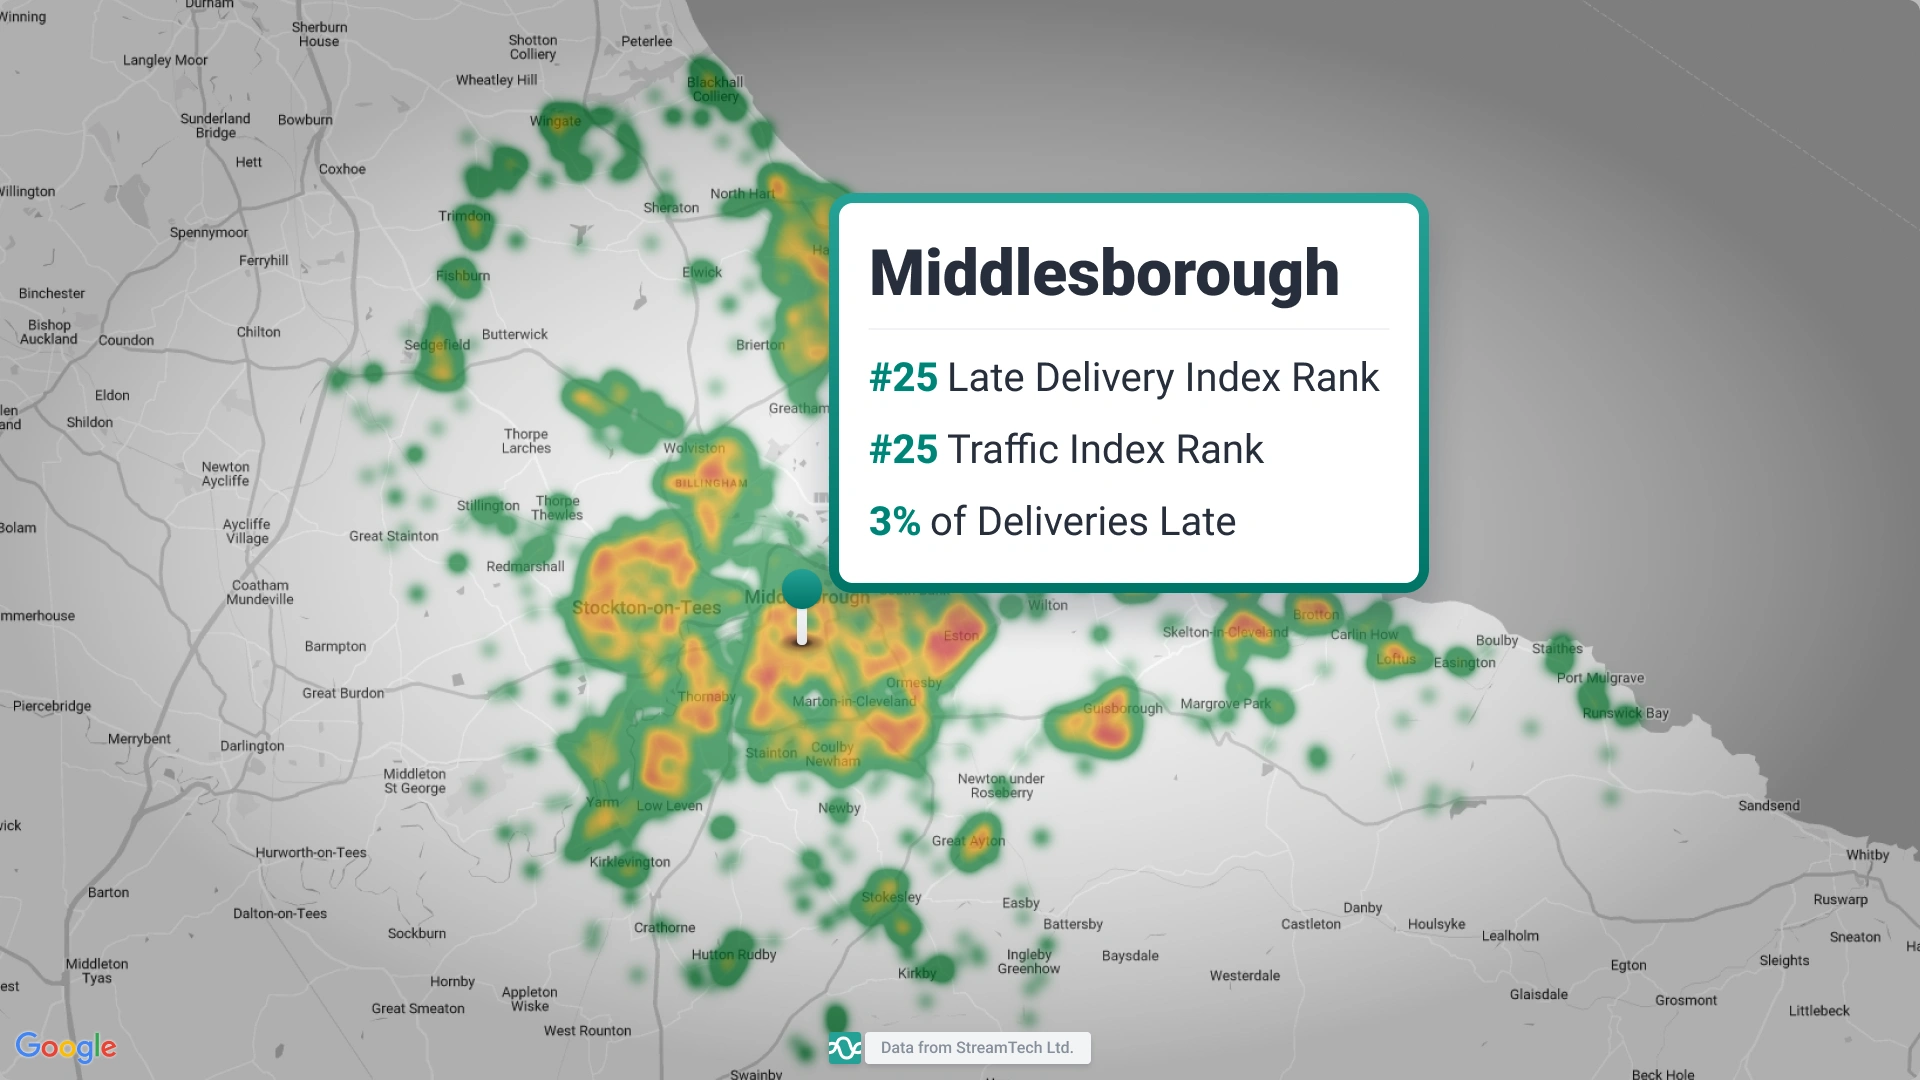
1. Middlesbrough
Just 3% of deliveries in Middlesbrough arrived late in 2023 — that’s less than a third as many as the national average — Middlesbrough not only ranked 25th in the Late Delivery Index, but also in the UK traffic index ranking (taking just over 11 minutes to travel 10km, which is a whopping 26 minutes less than it does in London).
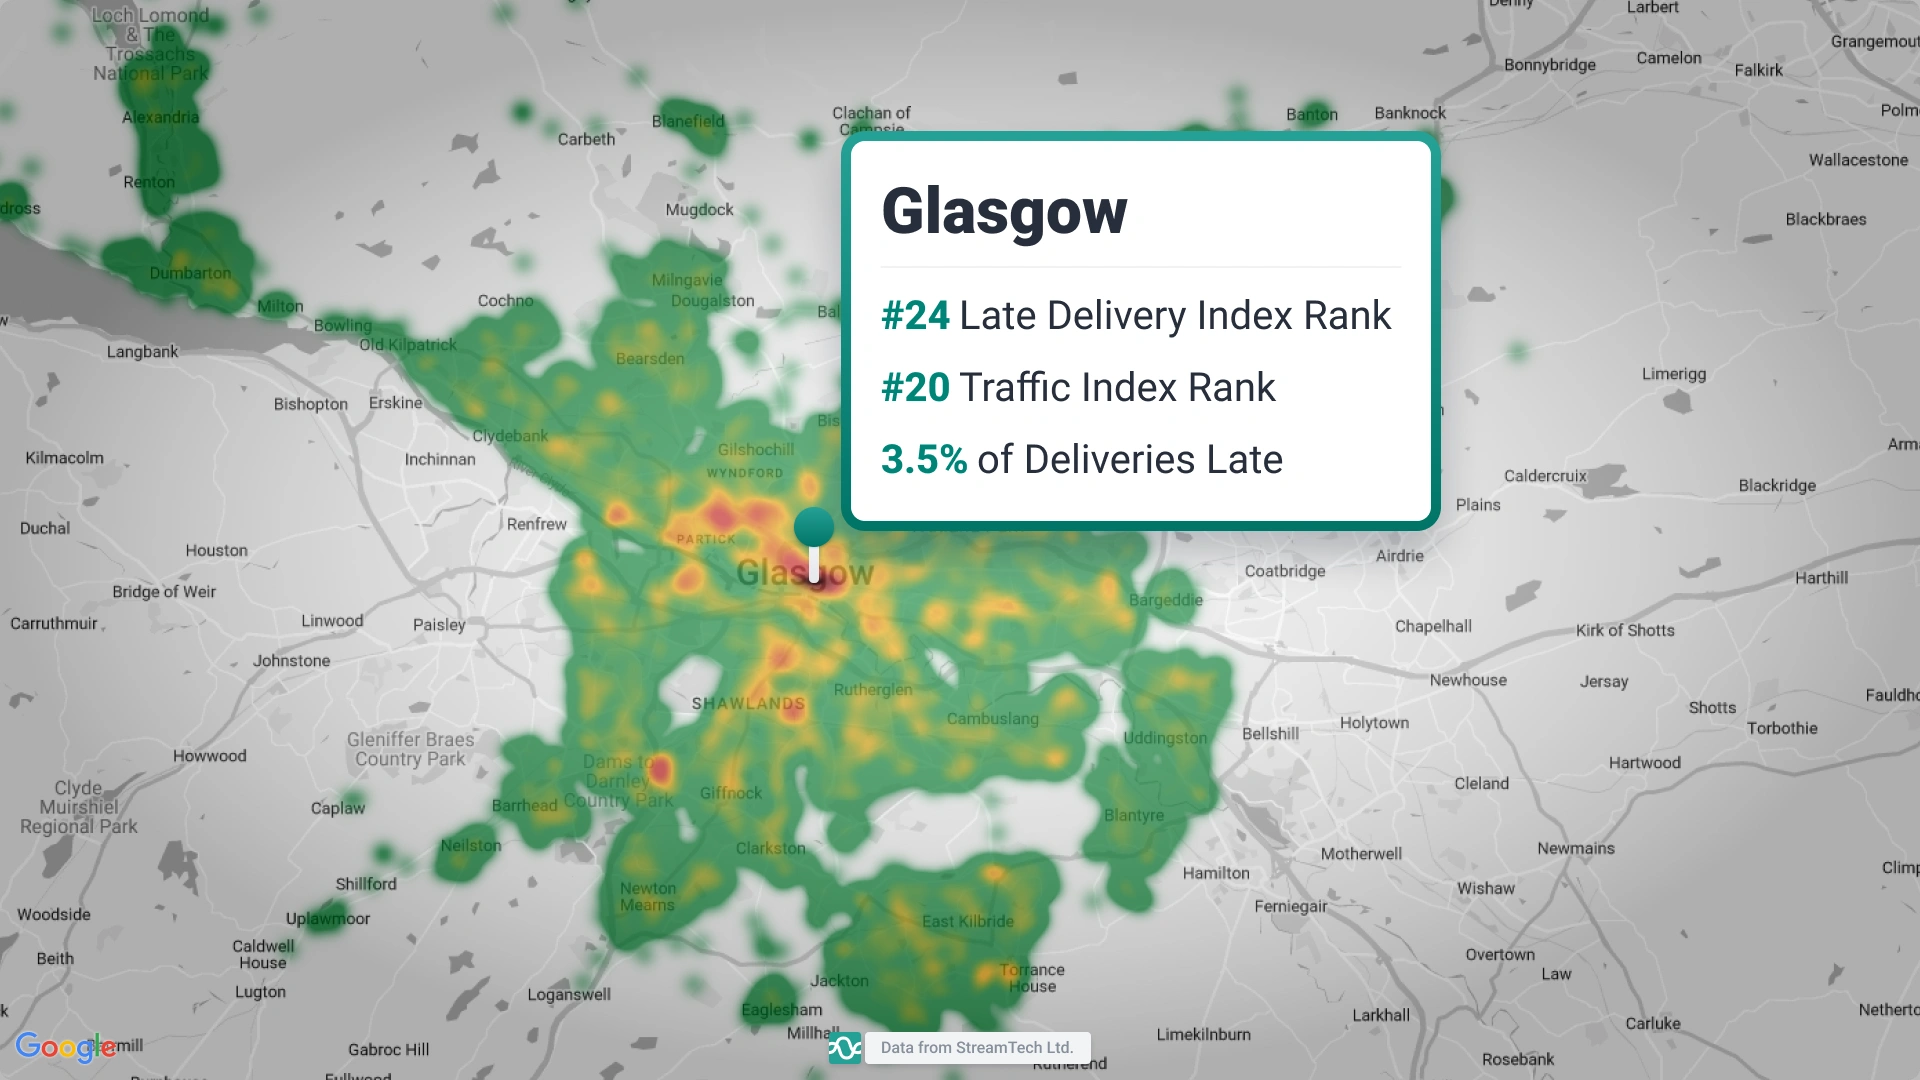
2. Glasgow
In Glasgow, 3.5% of deliveries arrived late — still less than a third as many as the national average, and the city comes in 20th in the UK for traffic rankings.
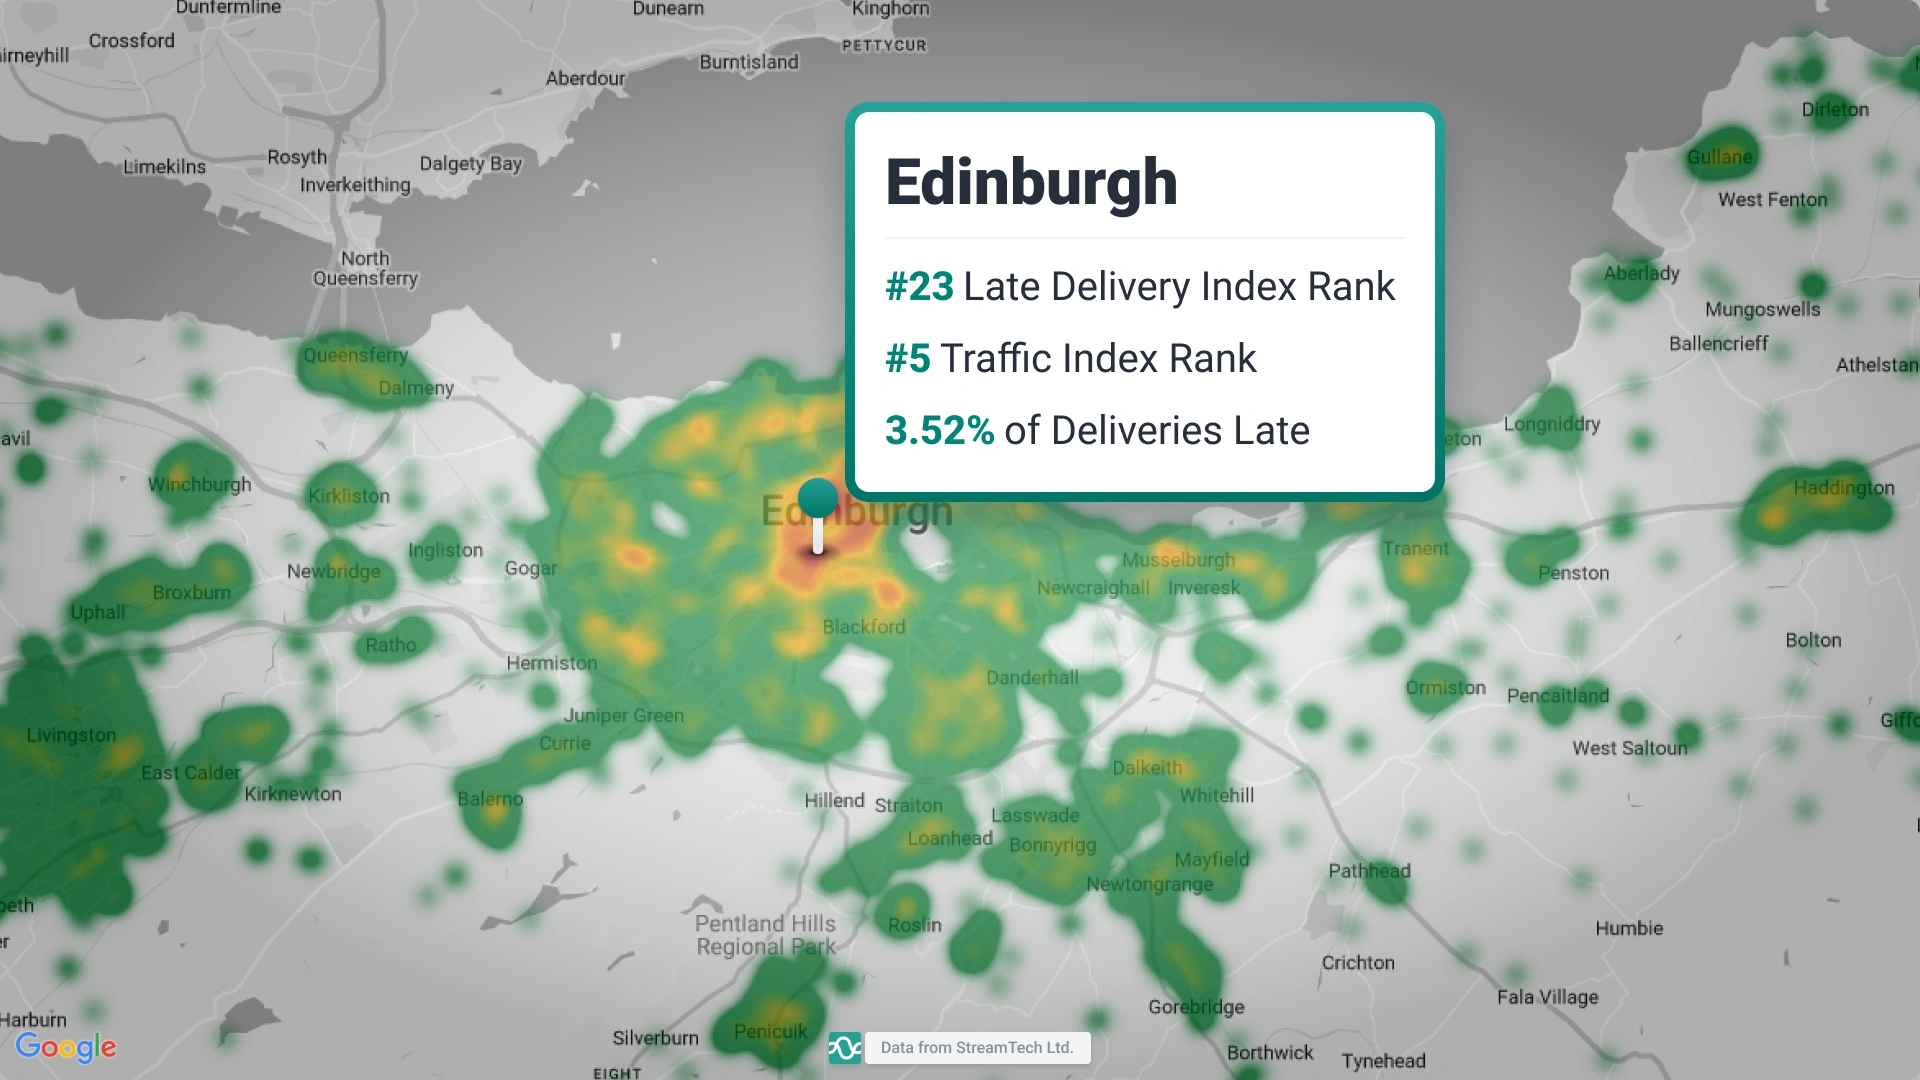
3. Edinburgh
Just behind Glasgow, just 3.52% of deliveries in Edinburgh arrived late, however Edinburgh comes in 5th place for traffic rankings.
See the full Late Deliveries Index
TomTom data highlights London as the worst UK city for traffic
Based on data collected from 600 million in-car navigation systems and smart devices, the TomTom index calculates the average travel time per kilometre.
Now in its thirteenth year, the 2023 version “confirms the general decline in average speeds in most cities: of the 387 cities analysed in the traffic index”.
Commenting on the TomTom index, Ralf-Peter Schäfer, Vice President of Traffic at TomTom said:
“With more than half of the world’s population living in urban areas, traffic congestion and its economic, ecological and health consequences have become a problem that needs to be urgently addressed. Planning the future of urban areas is essential to ongoing traffic management.
“Analysis of historical traffic data can help growing cities map more efficient road systems and plan better zoning using location intelligence”.
TomTom’s Traffic Index has become an important tool for urban planners and policymakers as it helps to understand – and manage traffic congestion – providing insights into the impact of congestion on a city’s transportation infrastructure and economy.
Real-time information from providers such as TomTom, can provide traffic data that feed the algorithms used by municipalities across the globe to manage traffic jams by optimising road logistics and routes.
So, how does Stream’s Late Delivery Index compare to TomTom’s traffic index?
1. London
London takes the crown as the number one worst city for traffic worldwide, taking an average of 37 minutes and 20 seconds to travel just 10km. Only 11.8% of deliveries in London arrived late in 2023 though, just a touch more than the national average, putting the city at number 11 in the UK late delivery ranking.
This could be due to delivery density. In densely populated areas such as London, there are likely to be shorter distances between delivery drops. So while traffic may slow drivers down, they likely don’t have as far to travel as they do in less densely populated areas.
2. Manchester
Taking an average of 23 minutes and 30 seconds to travel 10km, Manchester is second in the UK (and 29th in worldwide rankings) for traffic, but 14.75% of deliveries in Manchester arrived late — making it number 5 in the UK late delivery index.
3. Liverpool
Third in the UK, and 34th worldwide, it takes an average of 22 minutes and 50 seconds to travel 10km in Liverpool, while 10.93% of deliveries arrived late — less than the national average and 13th in the UK late delivery index ranking.
Stream’s Late Delivery Index
The Stream Late Delivery Index takes the 25 UK cities in TomTom’s Traffic Ranking Index and checked for deliveries that arrive later than their given ETA (as a percent of the total deliveries). The index is based on delivery data from over 150,000 deliveries made in the UK in 2023.
| City | Stream Late Delivery Index Ranking | TomTom Traffic Index Ranking |
|---|---|---|
| Nottingham | 1 | 8 |
| Sheffield | 2 | 6 |
| Leicester | 3 | 7 |
| Coventry | 4 | 22 |
| Manchester | 5 | 2 |
| Birmingham-Wolverhampton | 6 | 21 |
| Leeds-Bradford | 7 | 11 |
| Preston | 8 | 16 |
| Hull | 9 | 13 |
| Cardiff | 10 | 9 |
| London | 11 | 1 |
| Southampton | 12 | 17 |
| Liverpool | 13 | 3 |
| Stoke-on-Trent | 14 | 23 |
| Reading | 15 | 12 |
| Portsmouth | 16 | 24 |
| Belfast | 17 | 18 |
| Bournemouth | 18 | 10 |
| Bristol | 19 | 4 |
| Swansea | 20 | 15 |
| Brighton and Hove | 21 | 14 |
| Newcastle-Sunderland | 22 | 19 |
| Edinburgh | 23 | 5 |
| Glasgow | 24 | 20 |
| Middlesbrough | 25 | 25 |
Delivering more, on time and in full
It might be impossible to remove the impact of slow traffic on your delivery times, there are definitely strategies any logistics operation can take to minimise its impact and ensure your business makes reliable, and consistent deliveries.
Delivery times are inevitably affected by slow traffic.
However, while traffic levels do have some correlation with late deliveries, slow traffic that is predictable shouldn’t necessarily make deliveries later than planned.
As Dave Brailsford, current team principal at the professional cycle team, Ineos Grenadiers, coined whilst performance director at British Cycle, businesses making deliveries are able to ‘control the controllables’ to reduce the likelihood of late deliveries.
This is especially the case when you use a route planning software, such as Stream, which takes historical traffic data into account (in our case traffic data from Google), when scheduling and optimising delivery and collection routes.
Though it might not always be practical, businesses can look into the possibility of planning schedules that avoid peak traffic hours.
Depending on the size of the business, and complexity of its logistics operation, data can help determine strategically if alternative networks might be required, i.e. adding delivery hubs or creating micro-fulfilment centres near to high density customer locations to shorten final-mile delivery distances.
Businesses can, as well, set realistic time windows for deliveries.
With Stream, operators can specify 2-hour, 3-hour, am or pm; or all-day delivery windows and communicate those with their customers.
These options provide businesses with the opportunity to account for potential traffic delays, as well as set expectations for customers.
On the day of delivery, proactive delivery notifications and real-time delivery tracking enable operators to communicate clearly and transparently with their customers throughout the day.
Nothing, however, always goes to plan, and that is equally true in a busy transport office managing even a medium sized fleet.
But having the ability to manage their operation ‘by exception’, i.e. the circa 10% of deliveries that could be late, ensures that businesses can make adjustments during the day and keep customers updated more easily.
After all, good communication delivers excellent customer service.
And excellent customer service leads to increased customer satisfaction and loyalty.
