Heatwaves. Tropical storms. Wildfires.
This time of year can really bring home the impact of climate change.
In the logistics sector, we’re all acutely aware that our industry is a high contributor to Carbon Dioxide (CO2). In fact, the ISO estimates that the logistics and transport sector contributes just over a third of CO2 emissions.
But reducing CO2 emissions isn’t just about saving the planet.
Lower energy consumption can reduce running costs, make your overall operations more efficient, help you meet sustainability targets, and even become a competitive advantage.
If you can accurately report on your fleet’s CO2 emissions and find your baseline, then you can start to optimise your logistics processes. From there, you can demonstrate your commitment to CO2 reduction month on month and year on year.
Why track CO2 and mileage?
We know that emissions of CO2 are responsible for the climate crisis. As leaders and practitioners in the logistics sector, we all have an ethical responsibility to reduce the emissions from our operation.
At first glance though, it might seem as though emissions tracking and reduction is a business cost centre.
But that doesn’t have to be the case.
How reducing CO2 can be good for business
Alongside helping the environment, reducing emissions can help your business with:.
- Cost savings: Reducing emissions is all about improving fuel efficiency — so your fuel spend goes further. Driving efficiently can also reduce wear on vehicles, further cutting fleet overheads
- Compliance: A big factor in many organisations’ commitment to reducing fuel consumption is compliance with environmental regulations (and avoiding regulatory penalties). While most SMEs in the UK aren’t required to measure and report carbon emissions, there are some instances (such as when bidding for a government contract) when carbon reporting is required. Additionally, SMEs working with public sector organisations or large companies may be asked to provide carbon reporting information as part of their supply chain contract
- Credibility: Demonstrably reducing your emissions can enhance your credibility and reputation as a climate-conscious business. That reputation can pay off when it comes to attracting and retaining customers and investors
How mileage affects CO2 emissions
When we talk about vehicle CO2 emissions, we refer to the grams of carbon dioxide the vehicle emits per mile.
This can vary depending on a number of factors, including the vehicle type and weight, the age of the vehicle, the load weight, and the driving style.
Accurate CO2 and mileage data are essential for emissions reduction. You can’t improve if you don’t actually know the amount you’re using. So, how can you track your vehicle’s CO2 and mileage data?
How to track vehicle CO2 and mileage information
Now that we have a good understanding of the importance of mileage and CO2 data in emissions reduction, it’s time to get to work. You have a few options for recording and tracking the data.
Manual tracking
It is possible to manually track and calculate CO2 emissions and mileage data — either in a physical logbook or on a spreadsheet
If you know how many grams of CO2 each vehicle emits per mile, and can work out how many miles each vehicle does in a day, you can multiply one by the other to calculate how much CO2 you’ve used on that route.
You could also make the calculation monthly. You can then work out how many runs, drops and orders that vehicle made in that month to calculate the CO2 per run, CO2 per drop, and CO2 per order.
Drilling down to find and collate all that data, and put it in one place to calculate and analyse can be admin-heavy, with a lot of potential for human error in the data input.
App-based tracking
That’s where App-based tracking comes in.
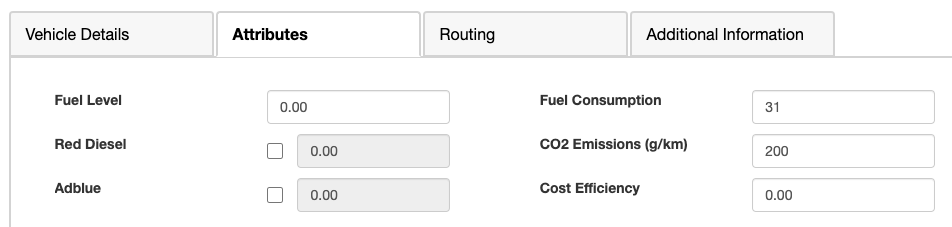
You only have to enter the vehicle CO2 data once (when setting up your vehicle types), and Stream will calculate your daily, weekly, monthly and annual CO2 emissions per vehicle, run, drop, and order based on mileage entered by drivers at the first check of the day and the next check (whether that’s an end-of-day check or the first check of the next day).
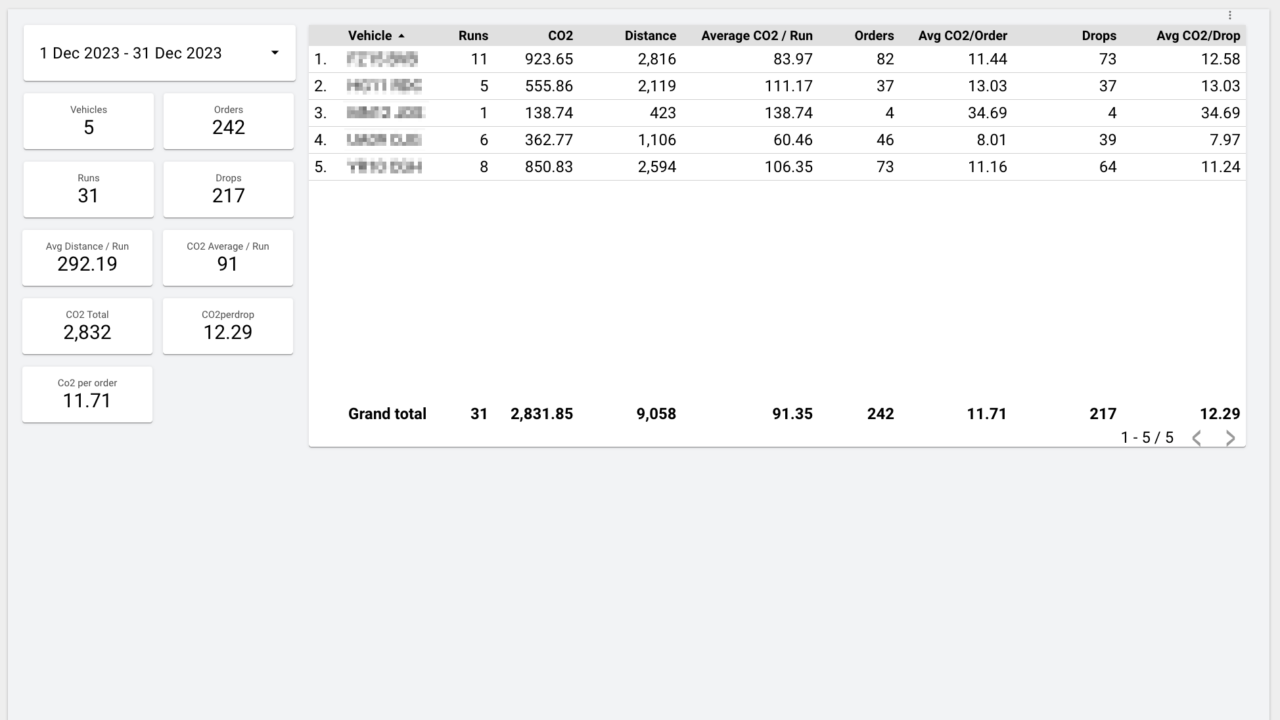
You don’t have to do anything else, your CO2 emissions are automatically visible in the emissions dashboard in your Stream account.
Telematics tracking
Of course, If you already use a telematics solution, such as applications provided by Teletrack Navman, you may also be able to access detailed carbon emissions reporting as part of their tracking data.
Where to find vehicle CO2 data
Once you’ve figured out your method for tracking and calculating your CO2 emissions, you still need to find out the CO2 data for your specific vehicles.
You can find that information for new and used cars and LGVs in the UK on the government website here. For vehicles not included in the government data, the CO2 information may be available on the vehicle registration document or via the manufacturer’s website.
It is worth bearing in mind that vehicle CO2 emissions data per mile is an informed estimate. There will be slight variations based on factors such as load weight, driving style, and even road conditions.
How to accurately track mileage data
Tracking mileage data can be as simple as recording the vehicle’s mileage displayed on the dashboard, at the start and end of any trip.
While you could try to remember to record it manually in a paper logbook for later entry into a spreadsheet, there is an easier way.
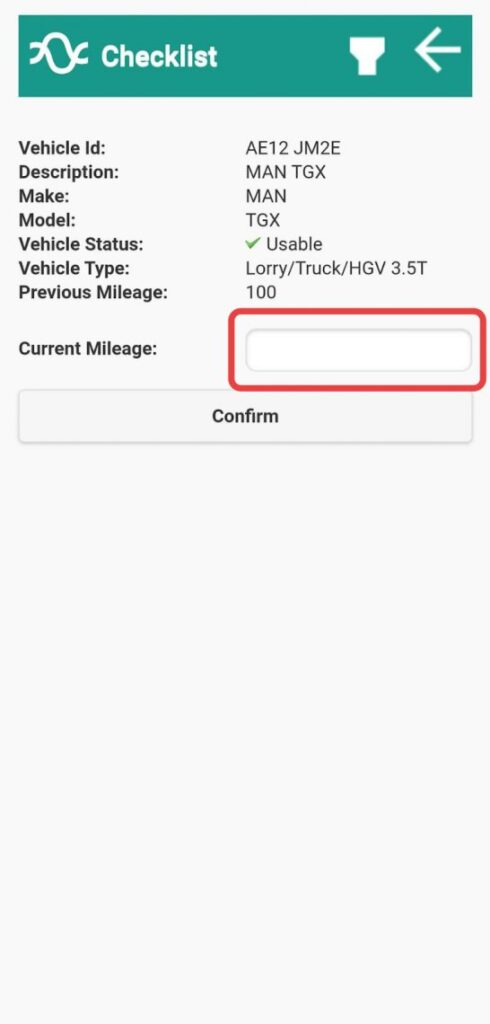
The Stream Driver App prompts you to record mileage as part of your walkaround checks. All you have to do is check and enter the mileage at the start of each run — Stream will automatically calculate and display your CO2 data in the CO2 report.
Tips for reducing CO2 emissions
Of course, once you are recording and analysing your vehicle’s CO2 emissions, the next step is to reduce those emissions by:
- Optimising delivery routes: Ensure delivery stops are completed in the most efficient sequence using route optimisation, reducing the overall mileage drivers have to cover
- Driving efficiently: Examine the way you accelerate and decelerate, and consider whether you could use more gentle pressure and work to maintain speed instead of speeding up and slowing down
- Maintaining vehicles: Vehicle maintenance issues, such as low-pressure tyers, can reduce fuel efficiency, so using a digital walkaround check system can also contribute to CO2 reduction
- Choosing the right vehicle: By matching vehicle size and payload capacity to the actual load weight is another way to maximise the fuel efficiency of your vehicles
- Exploring alternative fuel: As your existing vehicles come to the end of their lifecycle, you may wish to explore hybrid or full-electric vehicles, to further drop your CO2 emissions
Your CO2 emissions
Data accuracy is key to tracking and reducing CO2 emissions.
First, understand the CO2 emissions of your specific vehicle, then accurately input mileage data to get a clear understanding of your emissions.
From there, you can make fuel-efficient choices, and analyse the data over time, to see what is working.
Talk to our team today to check out Stream’s inbuilt CO2 reporting capabilities, and see how our route planning software and route optimisation capabilities can help you reduce CO2 emissions and deliver against your net zero goals.