In today’s world, many of us are aware of the sustainability implications of many of the actions we take, and this is no different for automotive manufacturers making the transition towards zero-emission mobility with alternatively-powered vehicles.
In April 2019, the European Parliament and Council adopted Regulation (EU) 2019/631, which introduced CO2 emissions standards for new passenger cars and light commercial vehicles within the European Union.
This regulation set reduction targets for passenger cars and light commercial vehicles alike, with vans required to reduce CO2 emissions by 31% by the year 2030.
Each year, the European Automobile Manufacturers’ Association (ACEA) produces a progress report, which aims to track the progress on key ‘enabling factors’ for zero-emission vehicles over time
In this post, we’ll be highlighting some of the key statistics from the report in relation to vans and commercial vehicles, however if you’d like to see the statistics relating to cars then you can check out the full report here.
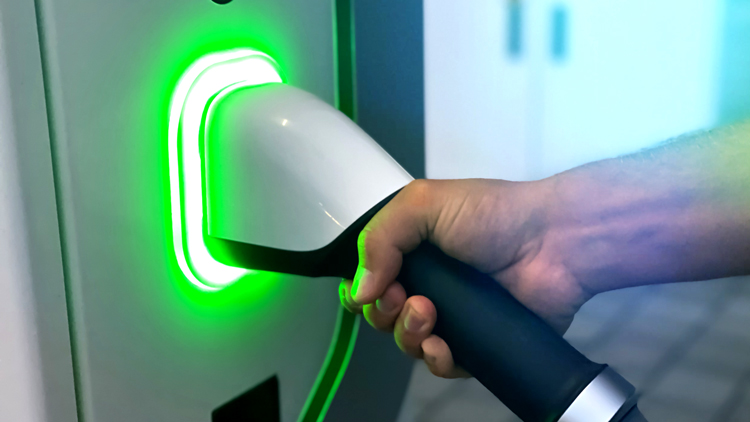
The 5 types of conventional and alternativey-powered vehicles
The most efficient way of lowering the amount of carbon emissions produced by vehicles is to utilise alternative means of powering them.
On this note, it’s important for us to understand the 5 different ways in which vehicles can be powered, as these are the power types that ACEA will cover in their report, and we’ll use their definitions to explain the key differences between each type.
- Conventionally-Powered Vehicles
Conventional vehicles are the ones we’re all used to in our daily lives, the vehicles which rely on fossil fuels (diesel and petrol) to power an internal combustion engine. Both diesel and petrol engines convert the fuel into energy via combustion, with the key difference between the two being the way in which the combustion occurs.
- Electronically-Chargeable Vehicles (ECV)
ECV’s are probably the most commonly thought of vehicles when it comes to alternative power. ECVs include full battery electric vehicles as well as hybrids, both of which require a recharging infrastructure which connects them to the electricity grid.
- Fuel Cell Electric Vehicles
Fuel cell electric vehicles (FCEVs) are also propelled by an electric motor, but their electricity is generated within the vehicle by a fuel cell that uses compressed hydrogen and oxygen from the air.
- Hybrid Electric Vehicles
Hybrid electric vehicles (HEVs) have an internal combustion engine (running on petrol or diesel) and a battery-powered electric motor. Electricity is generated internally from regenerative braking, cruising and the combustion engine, so they do not need recharging infrastructure.
- Natural Gas Vehicles
Natural gas vehicles (NGVs) run on compressed natural gas (CNG) or liquefied natural gas (LNG), the latter mainly being used for commercial vehicles such as trucks and the former for passenger cars. NGVs are based on mature technologies and use internal combustion engines. Dedicated refuelling infrastructure is required.
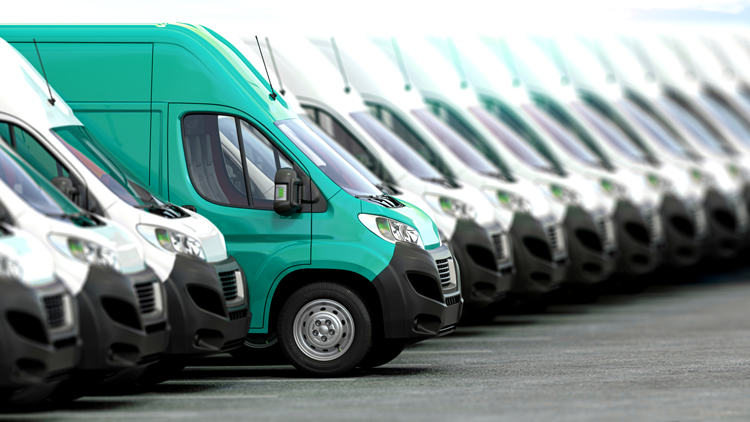
Market uptake of alternatively-powered and conventionally-powered vans
In 2020, 4.2% of new van sales were alternatively-powered. This is a progressive increase on the 2.8% that was reported in 2019, just one year before.
Of the 4.2% of alternatively-powered vans sold in 2020, 1.9% were battery electric ECV’s, 0.9% were hybrid-electric, 0.8% were natural gas powered and just 0.1% were plug-in hybrids.
To compare these figures to the non-commercial car marketing, the registrations of new electronically chargeable vehicles went from 387,325 in 2019, to 1,045,082 in 2020 (a 169.82% increase), which demonstrates the improved outlook that is developing towards a more sustainable future.
Between 2014 and 2020, sales of diesel vans increased by 231,555 units (to 1.3 million).
The number of battery electric vans sold in the EU went up by some 20,600 over this seven-year period, to reach 27,533 last year.
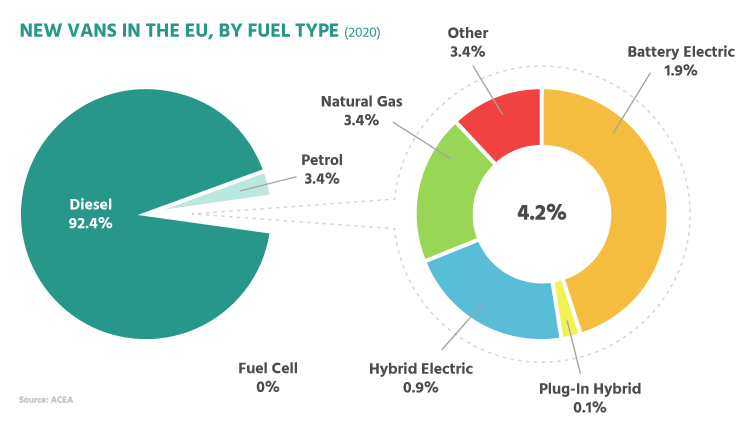
In 2020, 92.4% of all new light commercial vehicles (LCV) registered in the EU ran on diesel, which presented a slight increase when compared to 2019 (91.7%).
Petrol vans market share went down from 2019 to 2020, with petrol vans accounting for 3.4% of all new vans sold last year, down from 5.1% the previous year.
Today, battery electric vehicles account for just 0.3% of all light commercial vehicles on the EU roads and plug-in hybrids account for 0.02%.
Vans fuelled by natural gas account for 0.5% of the total EU van fleet.
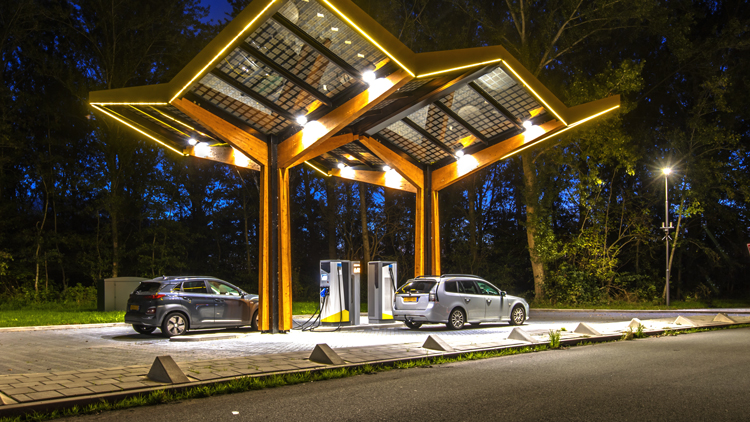
The infrastructure problem faced by aspiring zero-emission commercial operations
Many businesses are looking at moving towards using zero-emission vehicles, and in particular Electronically-Chargeable Vehicles, as a means of vastly improving the sustainability of their commercial operations.
However one of the key problems they are faced with is the accessibility of electronic charging points while their vehicles are out on the road.
Although there has been a strong growth in the deployment of charging infrastructure for alternatively-powered vehicles since 2014 (+750% from a very low base), the total number of charging points available across the EU (less than 225,000) falls far short of what is required.
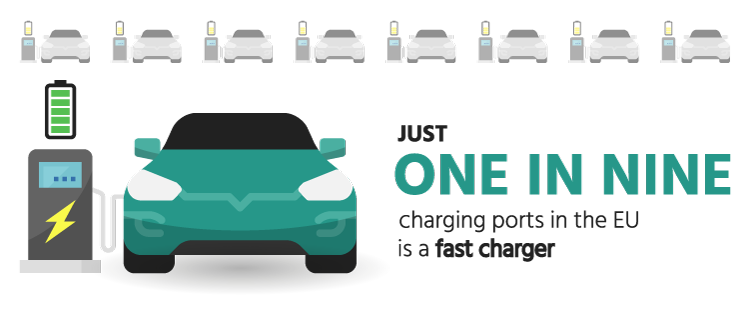
Under 25,000 of those points are suitable for fast charging (with a capacity of > 22kW), while ‘normal’ points account for the vast majority (about 200,000). Just 1 in 9 charging points in the EU is a fast charger.
70% of all charging stations within the EU are concentrated in just three countries, the Netherlands (66,665), France (45,751) and Germany (44,538).
Despite containing 70% of the charging stations, these three countries only make up 23% of the total surface area of the EU.
The Netherlands – the country with the most infrastructure – has almost 1,000 times more charging points than the country with the least infrastructure (Cyprus, with 70 charging points).
Progress towards Zero Emission Mobility with alternatively-powered vehicles
As it’s clear to see in the statistics that we have provided, the non-commercial vehicle market is making huge progress towards zero-emission mobility with nearly a 170% increase in the number of electrically charged vehicles being registered in 2020 over the same time the previous year.
The stats also show that vans and commercial vehicles, whilst making some steady progress, aren’t quite doing so as fast as the non commercial market and the report suggests that for this to improve drastically, some serious investment into the electrical charging infrastructure will be required throughout the EU.
For further statistics and more insight into Making the Transition to Zero Emission Mobility and alternatively-powered vehicles, you can check out the full report using the button below.
About the report
The auto industry’s investments in alternatively-powered vehicles are paying off: in 2020 more than one in 10 cars registered in the EU was electrically chargeable.
However, this positive trend can only be sustained if governments start making matching investments in infrastructure, and put in place meaningful and sustainable incentives.
The European Automobile Manufacturers’ Association (ACEA) publishes this statistical report – now in its fourth edition – on an annual basis in order to monitor the availability of infrastructure and purchase incentives.
The aim is to track progress on these key ‘enabling factors’ for zero-emission vehicles over time.
View the previous reports here:
